David Andrews Online Portfolio
This lab comes with a prescribed set of questions, with instructions reading: “This laboratory is designed to be a “programmed learning experience”. It works best if the steps are completed in the order presented, and careful consideration for your answers is taken. Don’t rush it. Simply answer the questions.”
Lathes N5 & N7 Process Capability Comparison
This lab comes with a prescribed set of questions, with instructions reading:
“This laboratory is designed to be a “programmed learning experience”. It works best if the steps are completed in the order presented, and careful consideration for your answers is taken. Don’t rush it. Simply answer the questions.”
Lathes N5 & N7 Process Capability Comparison
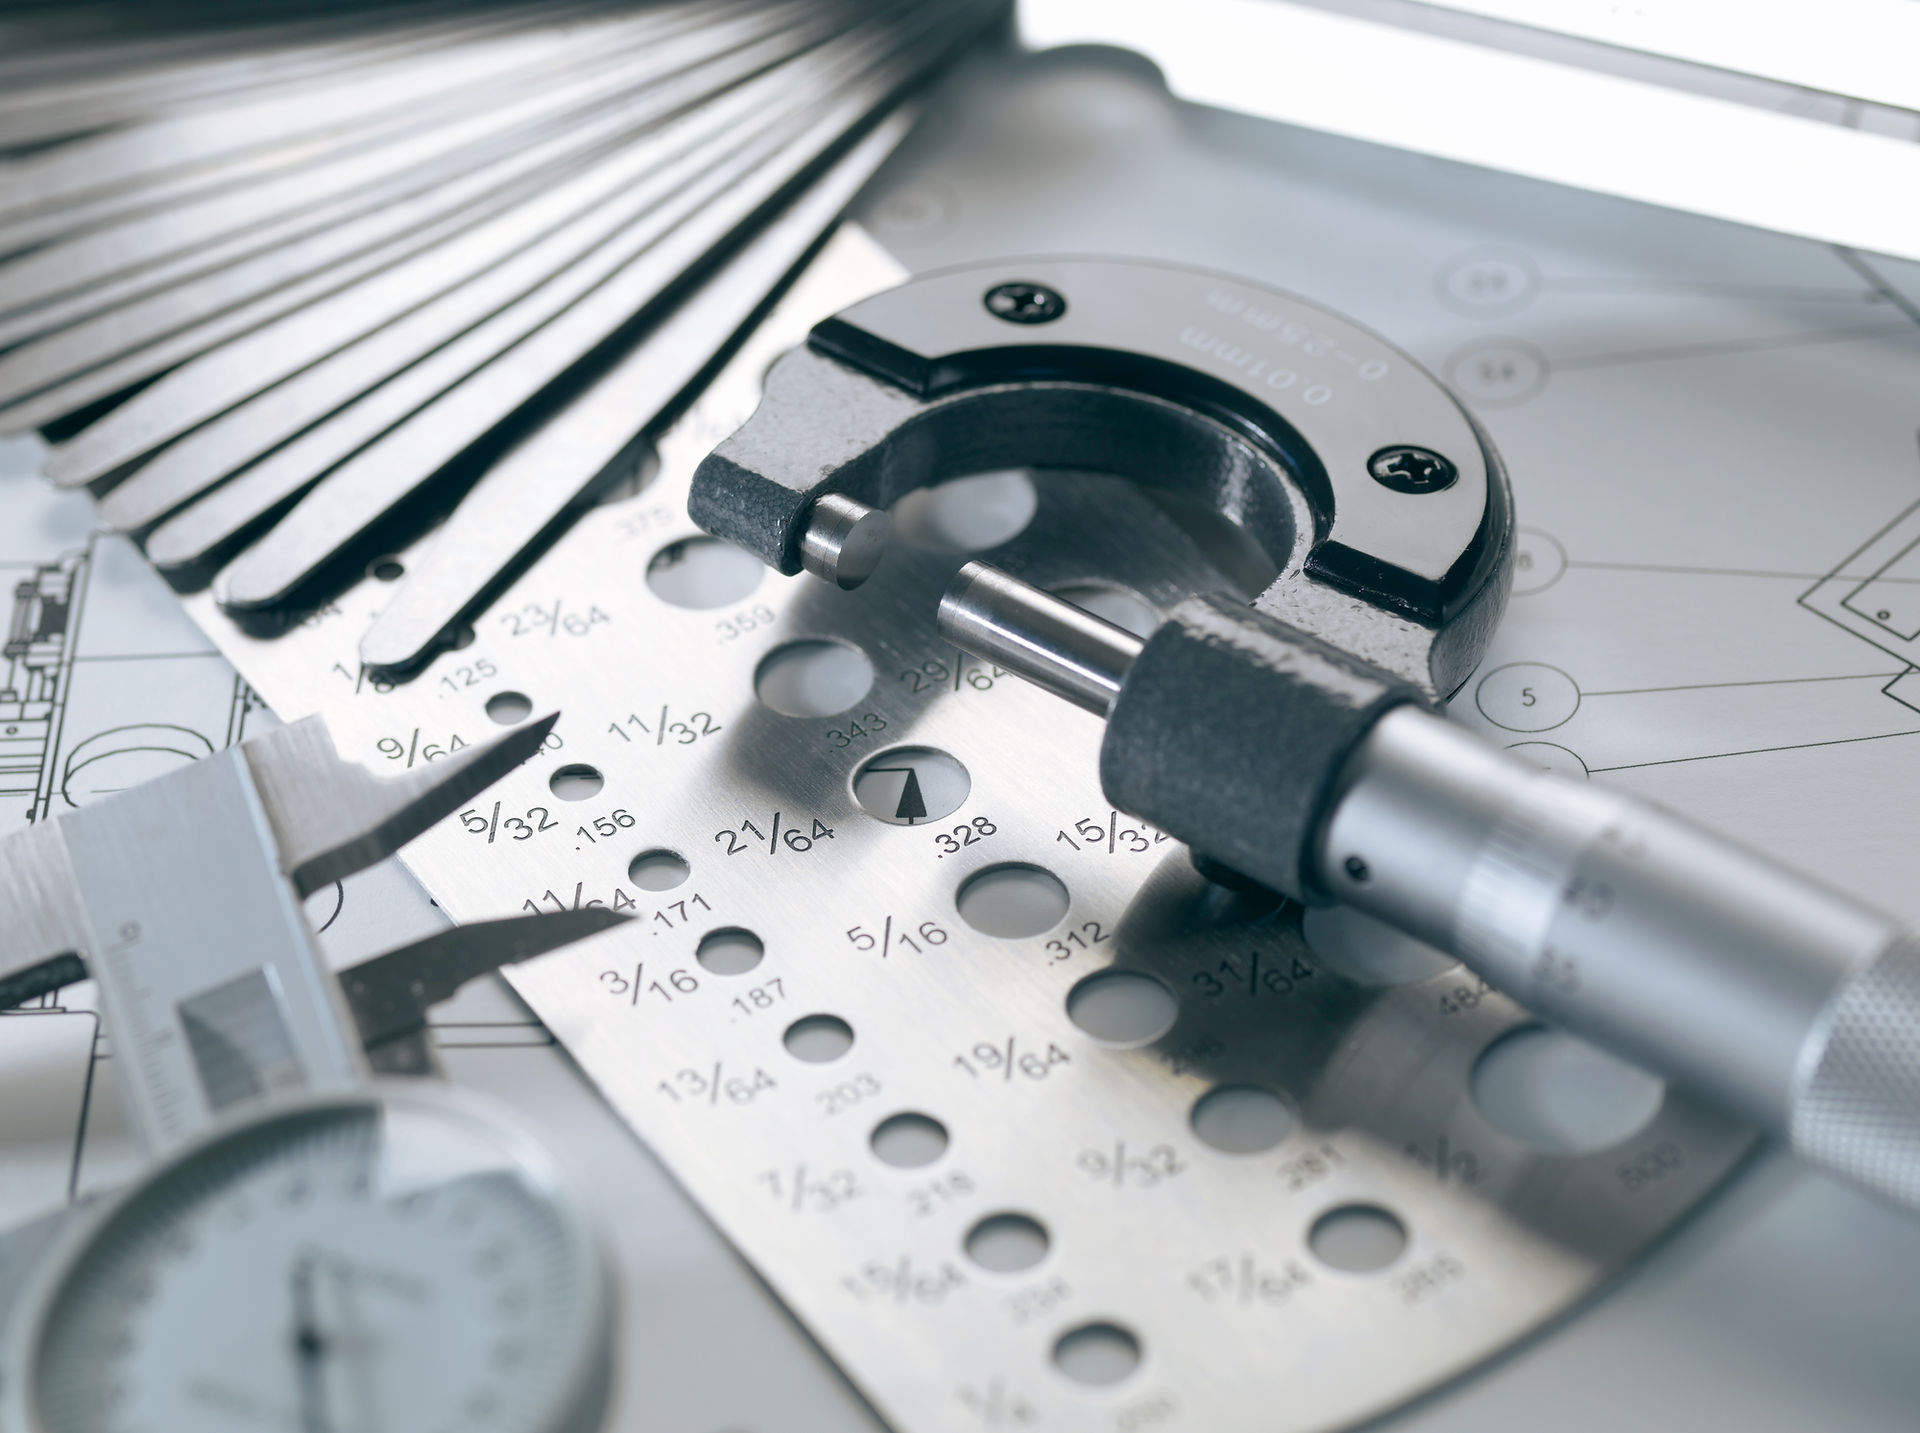
Two lathes on a manufacturing floor (Labeled N-5 & N-7) are turning small shafts, specified to be 0.258” ± 0.005”.
The turned parts are measured by a 0”1” thimble micrometer.
Six Sets of shafts are turned; from which 10 shafts each are measured to create the data set.
Qualitative Analysis of a Process Histogram
-
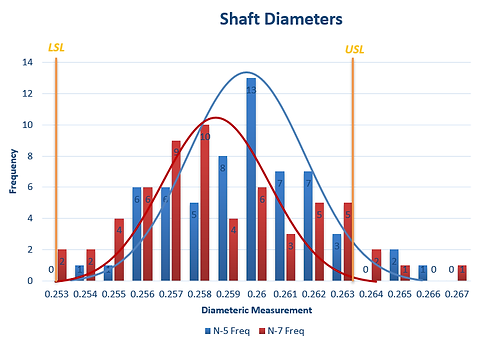
Qualitative Analysis: Create histograms for each process.
-
Without using statistics which process appears more capable?
-
Without any statistics, it seems that Lathe N-5 is more capable than lathe N-7. It has a smaller range, and min/max values more within specified limits. Comparing the specified limits to a histogram and judging the process visually, N-5 has three parts out of spec while N-7 has four parts out of spec.
Comparing the processes without statistical methods is unsafe practice. Range, Min/Max, nor histograms provide any indication of patterns. They cannot track history, and cannot be used to forecast production.
-
Quantitative Analysis
-
Grouped data analysis: Which process appears more capable from the Cp calculation
-
Do either/both processes appear stable?
-
Do either/both processes appear capable?
-
-
Evaluating the two process on the Process Capability Ratio shows Lathe N-7 to more capable than N-5.
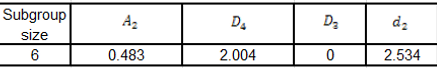
where is a is a constant for control charts, specified in Fundamentals of Manufacturing 3rd ed.
Sample Calculations, Lathe N5:
Lathe N5: Cp=0.650, Lathe N7: Cp=1.006
Neither of the Cp values are indicate capable process. A process with a Cp ratio less than 1 is considered incapable of producing good parts. According to Fundementals of Manf. 3rd ed, a process must have a Cp ratio of 1.33 and above to be considered acceptable.
Grouped Data Analysis is insufficient for gauging the stability of a process. Stability is a characteristic that is evaluated with respect to time, therefore it must be judged using a time related method such as SPC charts (X-bar, R, and x charts). Attempting to gage the stability by the Cp ratio would indicate lathe N-7 is more stable than lathe N-5.
Quantitative Analysis: X-bar, R, & X charts
-
Create SPC charts: Xbar, R, and X charts
-
Do both processes appear stable: are there any points that appear to be assignable causes?
-
Calculate the Cp from the SPC charts (6(Rbar/d2)). note: do not remove assignable cause values, if any
-
Are the processes similarly capable? Which is "better"? Are either/both capable at all?
-

The most prominent trends show up in the x-bar charts. It immediately obvious that Lathe N-7 is on a continuing trend. The diameter of the part is consistently growing, which has an assignable cause such as tool wear. Other than the outward trend from tool wear, Lathe N-7 itself is fairly stable.

The X-bar chart for lathe N-5 shows a rather unstable trend. Looking to the x-chart above allows us to extract more information as to why: for the first four subgroups, the diameters are very inconsistent. At subgroup 4 there is a sudden outward shift in the diameter, then the following four subgroups are relatively consistent. This indicates that there was an event which occurred at subgroup 4 for each set.
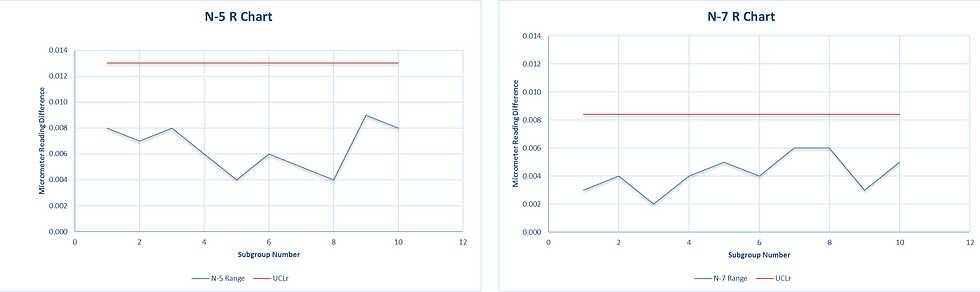
The data on the x-chart for lathe N-7 is much more stable than that of N-5. Notice that the data at each subgroup is packed tighter than that of Lathe N-5. THe Range Charts and average range reinforce this fact:
Lathe N5 Average Range: 0.007
Lathe N7 Average Range: 0.004
If the tool wear/movement issues are corrected, this lathe would likely be more reliable for capably producing parts. This is a point that Cpi calculations cannot point out. SPC Charts are essential in picking out any patterns in a manufacturing process.
Download Me